
The Problem
Marketing teams were losing hours every week to manual campaign setup, performance data scattered across separate channel tools, and analysis work that should have been automated. There was no single place to plan, launch, and optimize a multi-channel campaign — which meant no single source of truth for how a campaign was actually performing.
My Role
I opened with in-depth interviews with marketing managers and campaign coordinators to map their actual workflows, ran usability testing against their existing tool stack, and audited competitors to find where the real gaps sat. That research became personas and journey maps, which I used to sequence the build: information architecture first, then a clickable prototype, then a second round of user validation before any AI-generated feature shipped — the goal was to make sure automation solved a workflow problem marketers had actually named, not one that sounded impressive in a pitch deck.
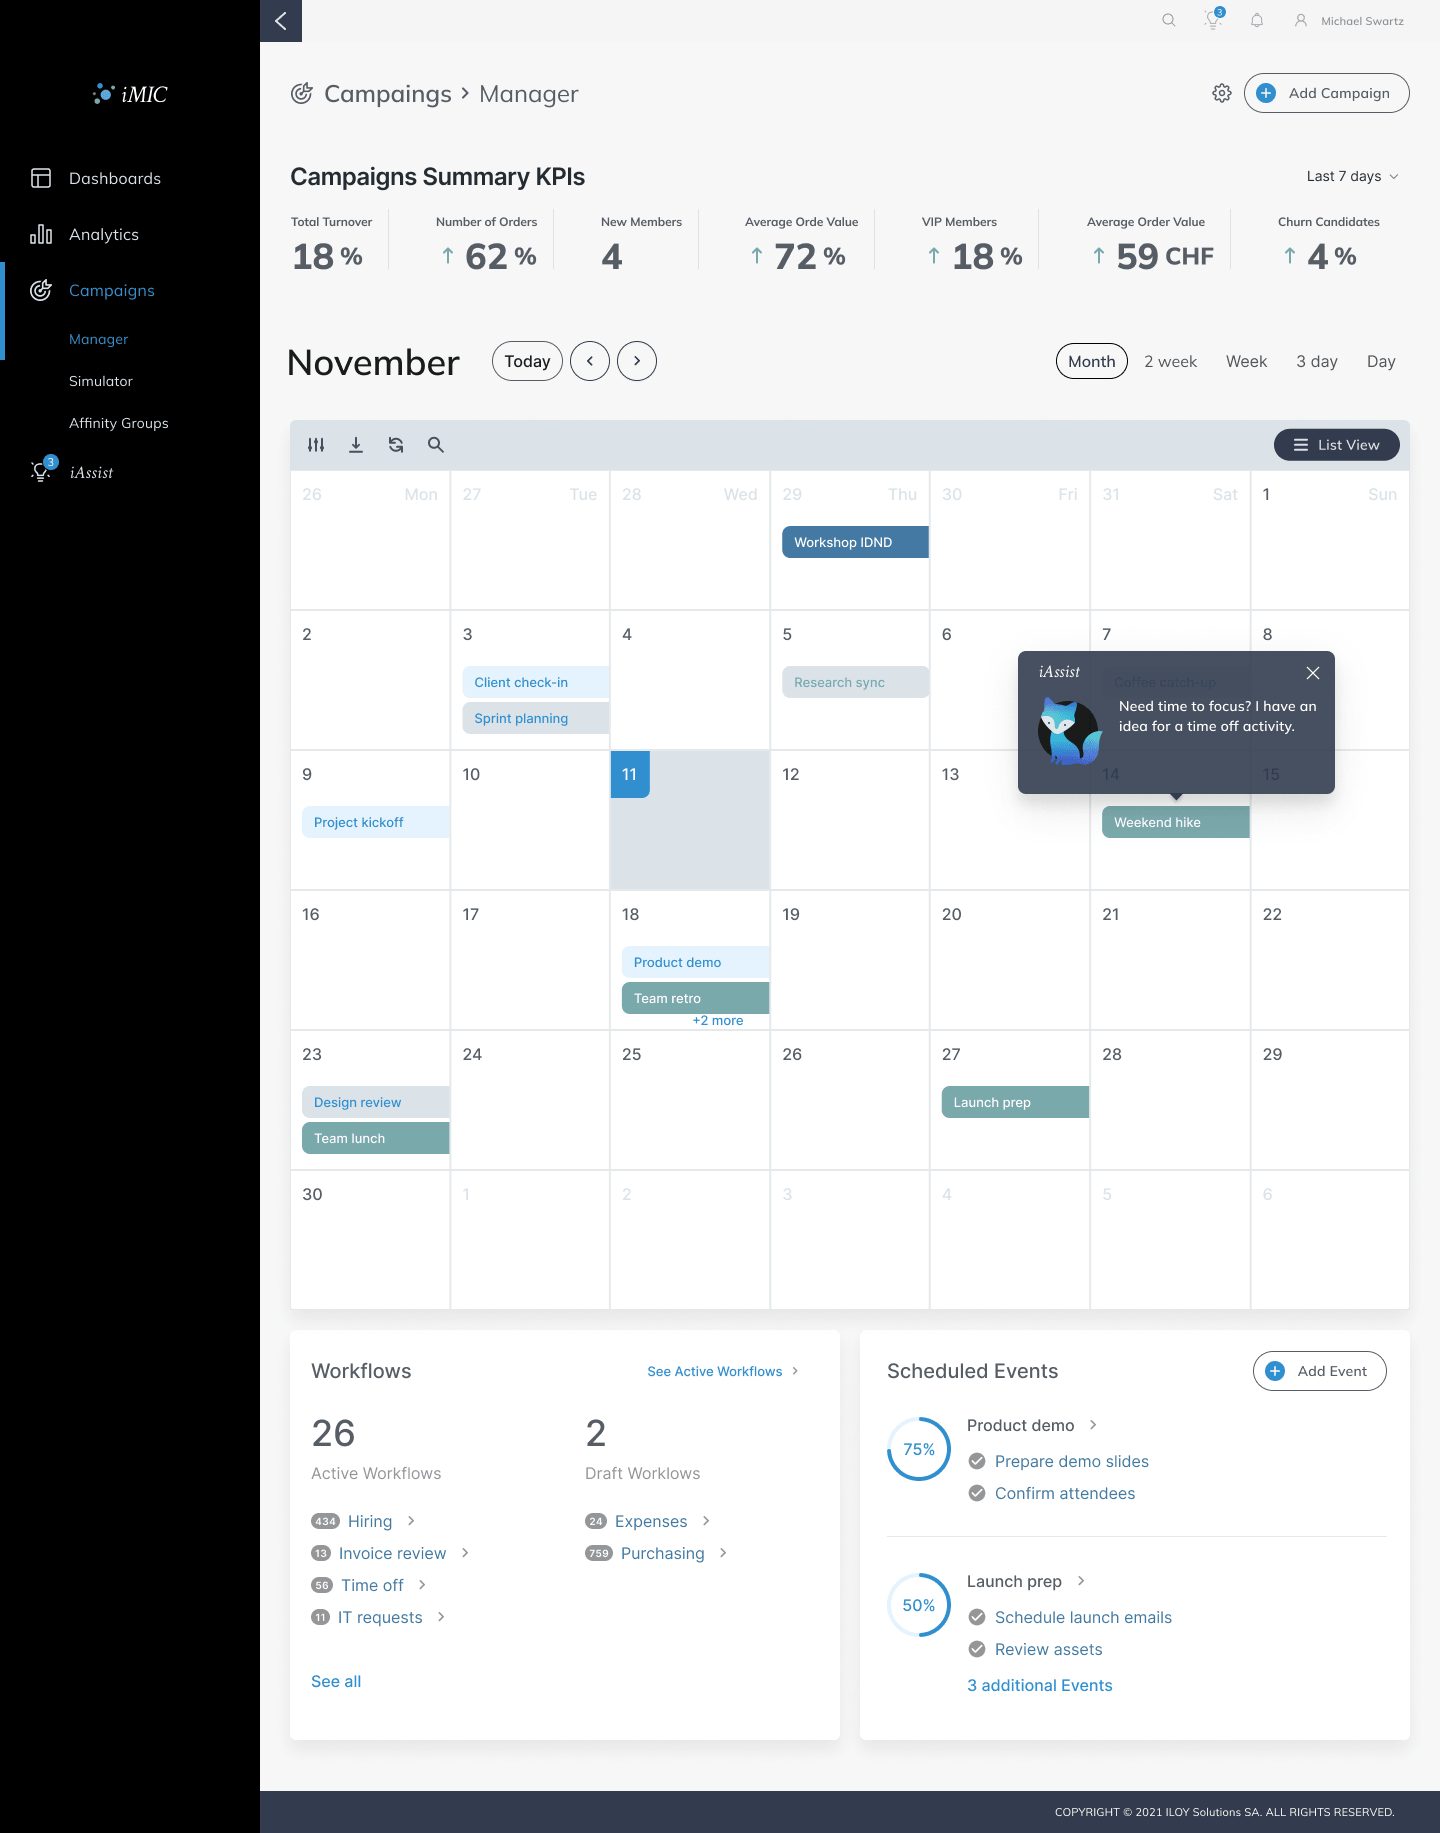
The iMIC Campaigns Manager interface displays a comprehensive monthly calendar view. The screen features top-level key performance indicators, such as Total Turnover and Average Order Value, above a central calendar grid populated with scheduled campaign events. The bottom panels track active workflows and scheduled events, while a dark sidebar provides global navigation. An 'iAssist' fox mascot overlay demonstrates how contextual help and AI assistance are integrated into the UI.

The iMIC Client 360 performance dashboard showcases an individual user profile designed for customer support and account management. The layout is centered around a user avatar and demographic data, anchored by a central vertical timeline. This timeline visually separates major customer lifecycle milestones on the left from chronological transactional events, such as card payments and email engagements, on the right.
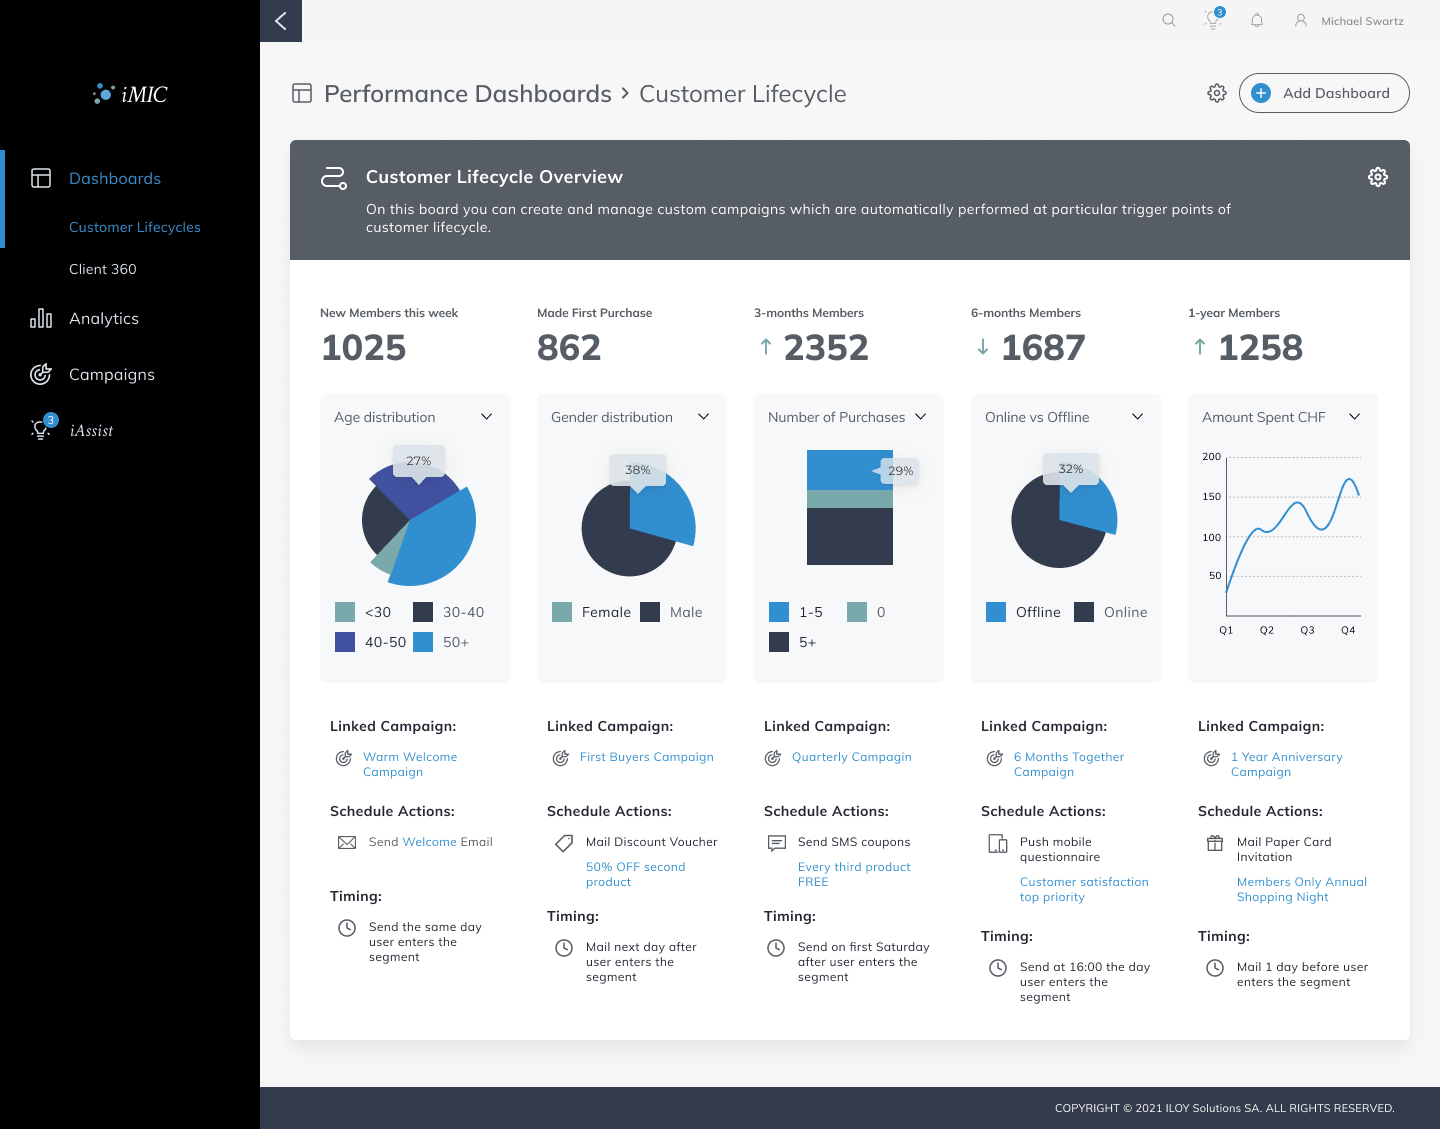
The iMIC Customer Lifecycle Overview dashboard is designed to manage custom campaigns triggered at specific user journey milestones. The interface features top-level acquisition and retention metrics above a series of data visualizations, including demographic pie charts and a spending line graph. Below each chart, the UI details the linked automated campaigns, scheduled actions, and precise timing parameters for that specific audience segment.
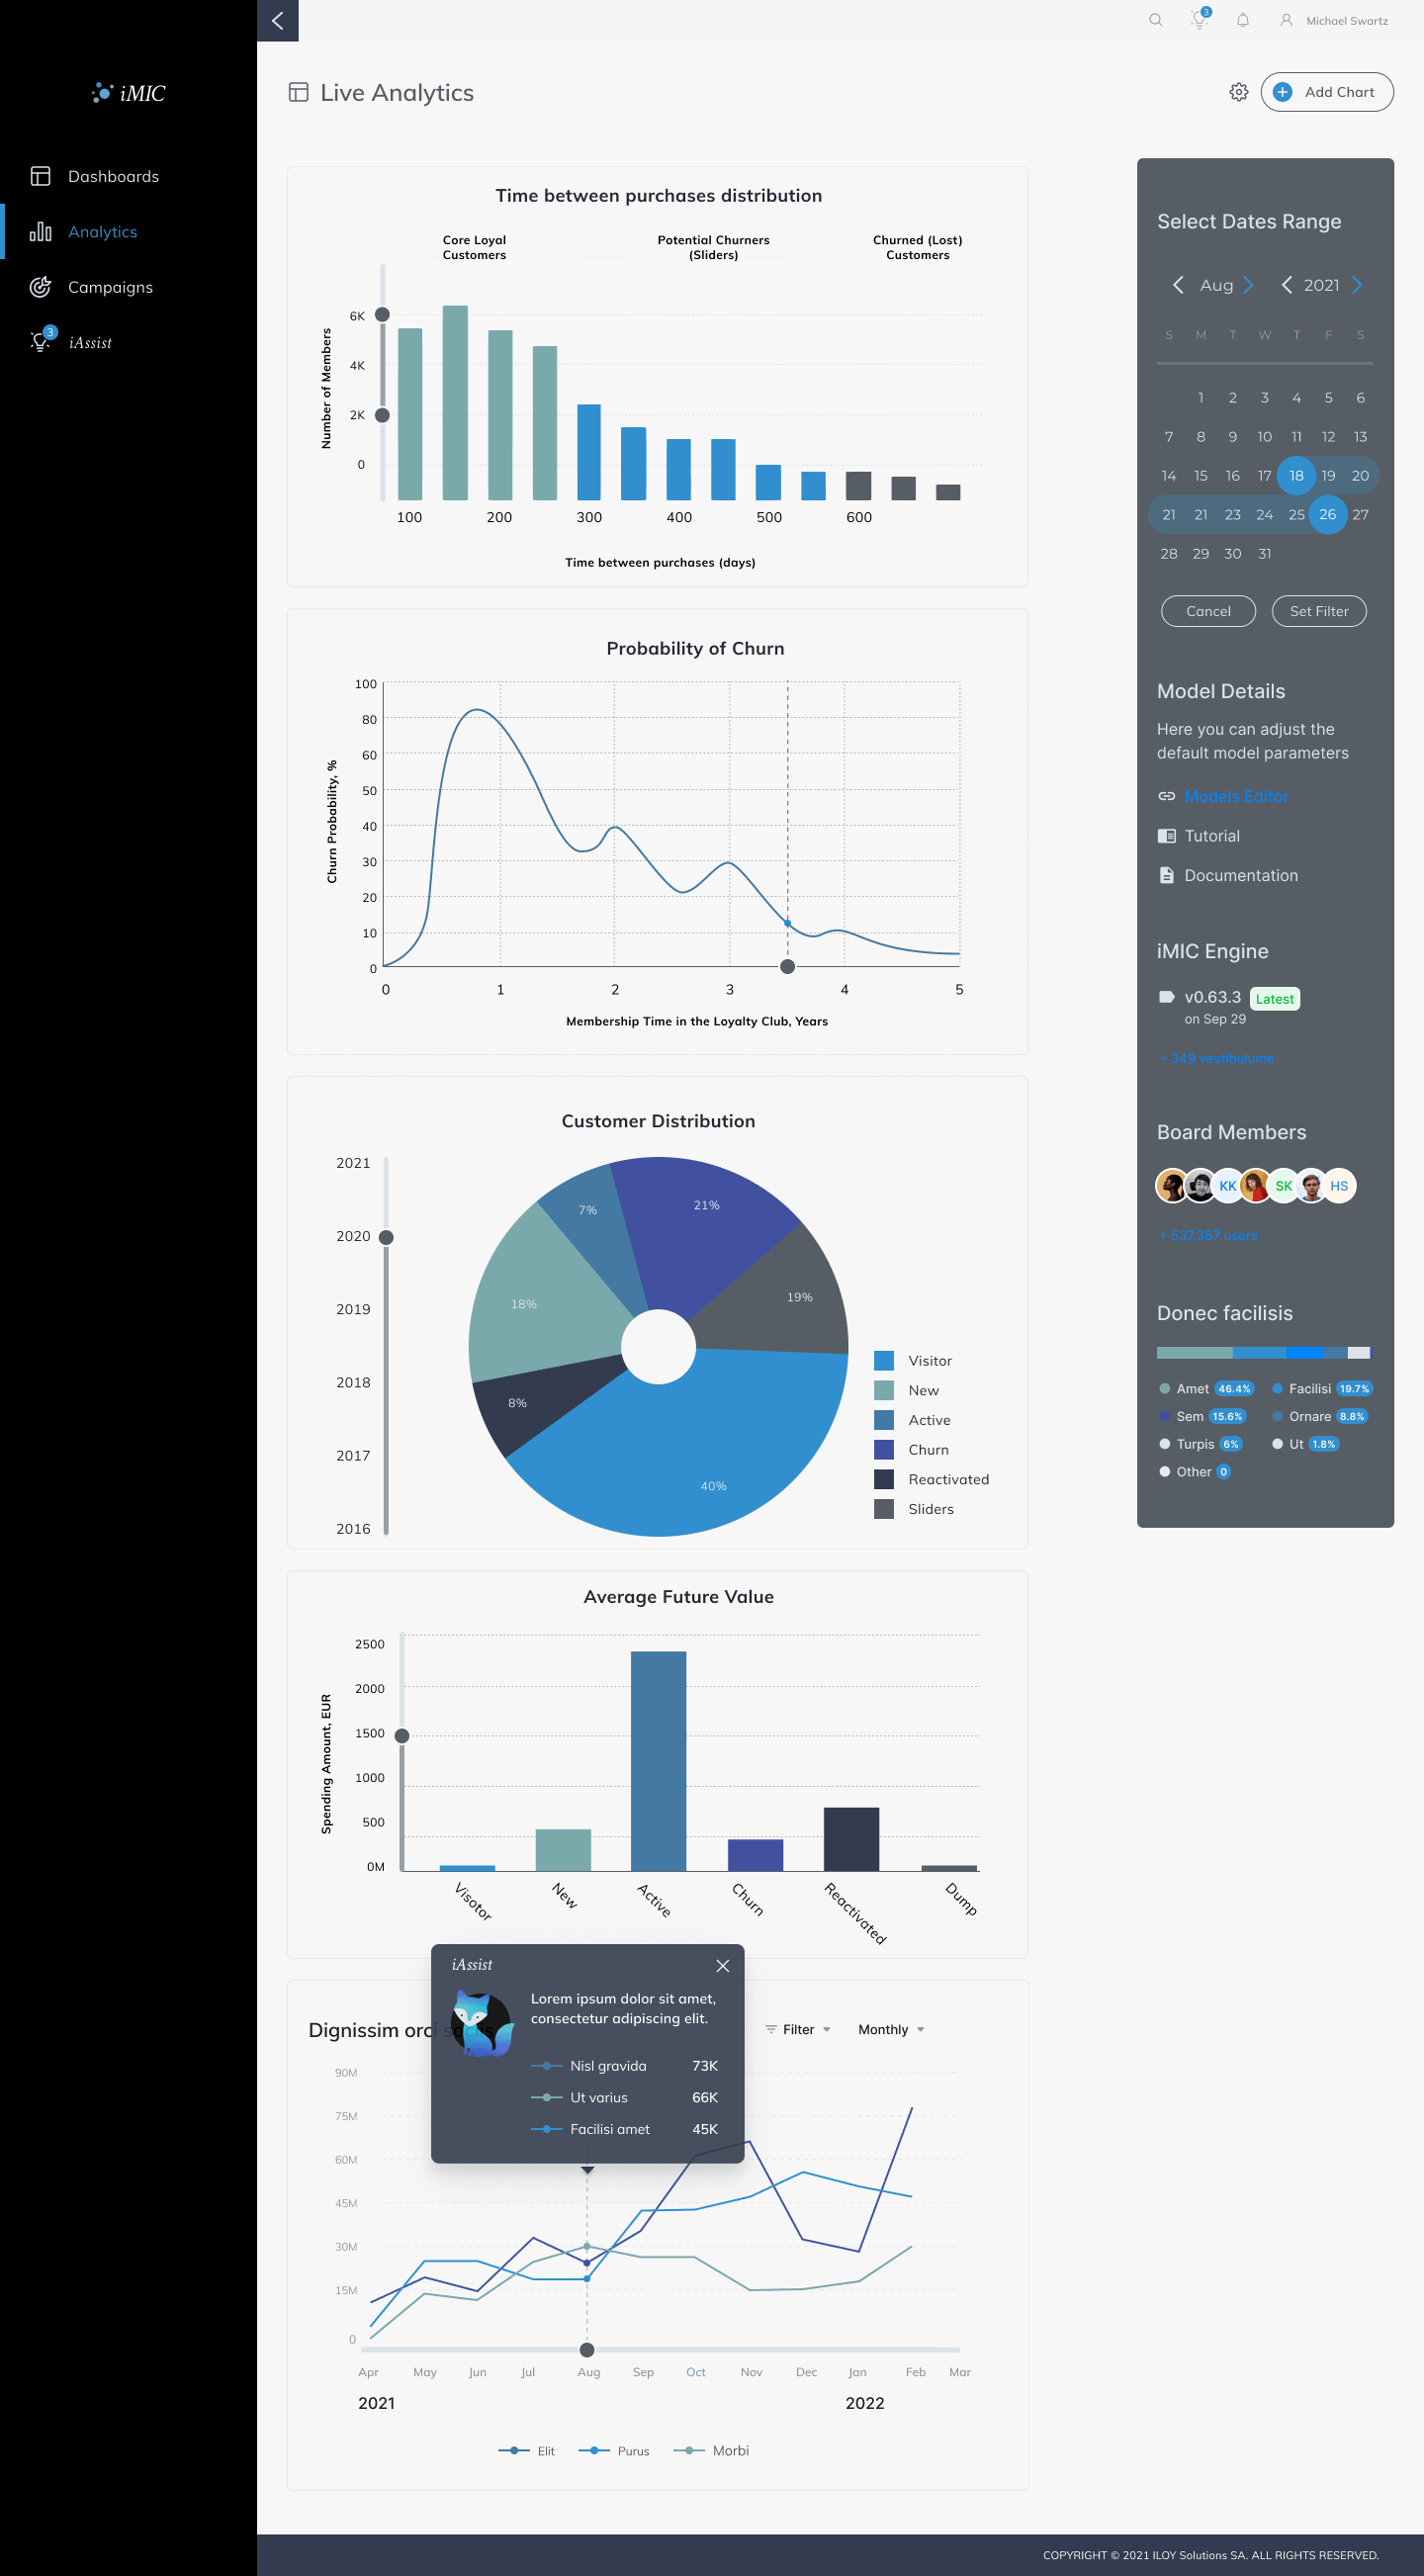
The iMIC Live Analytics interface presents complex data visualizations in a clean, modular layout. The main content area includes bar charts for purchase distribution, churn probability line graphs, and customer distribution pie charts. A functional right-hand sidebar houses a date range calendar selector, model parameter settings, engine details, and team member avatars for collaborative analysis.

The iMIC New Campaign interface showcases a drag-and-drop visual workflow editor for creating segment-triggered marketing campaigns. The top section allows the user to configure core metadata, including campaign names, target segments, and event triggers. The central canvas displays a node-based automated journey with A/B branching, where users can build out email and push notification sequences by dragging channel components from the right-hand tool palette.
The Result
The result is a single AI-powered campaign platform with drag-and-drop multi-channel setup, real-time performance dashboards, and automated analysis — validated with real marketers before ship, so the automation layer addressed workflows they'd specifically flagged as broken rather than features that looked good in a demo.

iMic Assist Analytics Dashboard